


For investors seeking evidence that this Bear Market is getting old in the tooth, we see several compelling indicators.
Famed stock market technician Eugene Peroni observed yesterday that:
"In some ways the major indices at this stage may be masking the improving underlying condition of the market when considering price architecture, net money flow trends and improving relative strength of many sectors."
(By the way, did you know that you can hear his daily market technical updates for free right on our homepage at Maendelwealth.com?)
At Maendel Wealth, we see mounting evidence that, much like the bull's back above the waterline, the painful downward sloping market charts of the last year actually hide a submerged beast ready to roar!

So which indicators have us sharpening our pencils and refining our buy lists?
Let's start with a technical indicator known as the McClellan Oscillator.
It's a unique market breadth indicator, or statistical measurement of the number of advancing stocks in the market relative to the number of declining stocks. Specifically, it measures the difference between the 19-day and 39-day exponential moving averages of net advancing stocks. The higher the difference, the wider the market breadth. The lower the difference, the narrower. The McClellan Oscillator is widely considered the best way to measure stock market breadth.
Right now it's showing a negative level we've only seen 1.4% of trading days in the last 32 years. It’s about as weak as the reading has ever been. It's telling us that we are at levels historically linked to “peak fear” and “peak weakness” in the market.
Here's the Good News. Stocks tend to rally big after the McClellan Oscillator gets this negative.
Of course, past performance is no guarantee of future results, but this indicator has flashed this exact same signal more than 100 times over the past 32 years. So far, without exception, the stock market was higher a year later, with an average return of nearly 30%.
Guess when the last time was that the McClellan Oscillator was this negative?
Yep – March 2020, at the lowest point of the COVID-19 pandemic.
How about before that? June 2016 – right after the Brexit vote.
And before that? June 2012, when everyone was worried that the economy would slip back into a deep recession.
The McClellan Oscillator was also this negative in June 2010 (foreign debt crisis), November 2008 (bottom of the great financial crisis), August 2002 (the bottom of the dot-com crash), June 1999, and August 1990.
What do all these months have in common? They were all very, very close to an absolute bottom after a stock market rout.
The other thing they have in common? Stocks Soared in the Following Months.
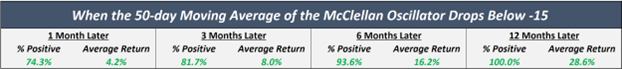
Here’s the data. Since 1990, in the 109 instances when the McClellan Oscillator dropped below -15:
- 74% of the time, stocks were higher a month later, with average returns of 4%.
- 82% of the time, stocks were higher three months later, with average returns of 8%.
- 94% of the time, stocks were higher six months later, with average returns of 16%.
- 100% of the time, stocks were higher 12 months later, with an average return of 29%!
In other words, right now we're seeing a historically attractive level on a technical indicator with an excellent track record (on over 100 data points) of calling stock market bottoms – and associated with solid returns over the next 12 months.
That seems like a pretty big deal, and a good thing for investors to know!

Don't let the ship sail without you:
Sir John Templeton was an investment legend and widely considered to be the Father of International Investing. His famous quote below was not just about investors piling in o the market on new highs thinking that the party must go on forever, but more importantly it was directed to investors who are scared away from taking advantage of market bottoms even when they know the historical indicators for such opportunities, because they are worried that somehow, this time, the rules don't apply (because of inflation, deflation, government incompetence, tax hikes, the threat of war. etc)
If you haven't yet read it, our related blog post from earlier this year has been shared around the web. It explores "what do you think would have happened if you "took cover" or went to cash after hearing about the unprecedented Japanese attack on Pearl Harbor, knowing it almost certainly meant the start of a World War?" https://www.maendelwealth.com/blog/the-pearl-harbor-market-bottom
Templetons' lesson was that it's almost NEVER "different" ,because the global hive-mind of the market which knows far more than any individual investor, has already factored in and "discounted" most of the dreaded scenarios. Missing, or worse, bailing out at market bottoms by falling into a perceptual or emotional "bear trap" can be very, very expensive to your long-term wealth building!

Here's another indicator that, while the bear market may not be completely over, it's most likely in its final innings, and that successful investors should probably be focusing on accumulating investments on their "buy lists" rather than flip flopping and agonizing about whether to get out. The crowd is almost always wrong, and the crowd is negative to the extreme as showing in the chart below. People are more negative right now than when they caught news of a killer virus and sudden forced global shutdowns back in early 2020. To seasoned investors, that smells like opportunity.

By the way, the reverse is true as well and may help you not to buy the top in the next market cycle. When too many investors are bullish, well... remember that the crowd is almost always wrong. Most of us can relate to the graphic below which sadly, represents the vast majority of investors (NOT you, of course!)

Bullish Factor: Seasonality! October is historically the "bear market terminator". Going all the way back to WWII, we can see that more bear markets have ended in October than any other month. There are many theories about why this occurs, but for whatever reason, it quite often does.

When taking a deep dive into the 17 bear markets since World War II, the average decline on the S&P 500 measured -29.6% and lasted roughly 12 months. The current bear of -25.4% and ~10 months is within the range for normal bear markets according to historical data: Take a look:

Here's another potentially Bullish indicator our team is looking at,
Stocks have gotten cheap and outright hated. And that means the gains – once the trend reverses – could be fantastic.
Let's take a look at Value. The easiest way to assess the market's valuation is the price-to-earnings (P/E) ratio. which compares current stock prices with current corporate profits. And as you'd expect, the P/E ratio is down big time during this bear market. Take a look...


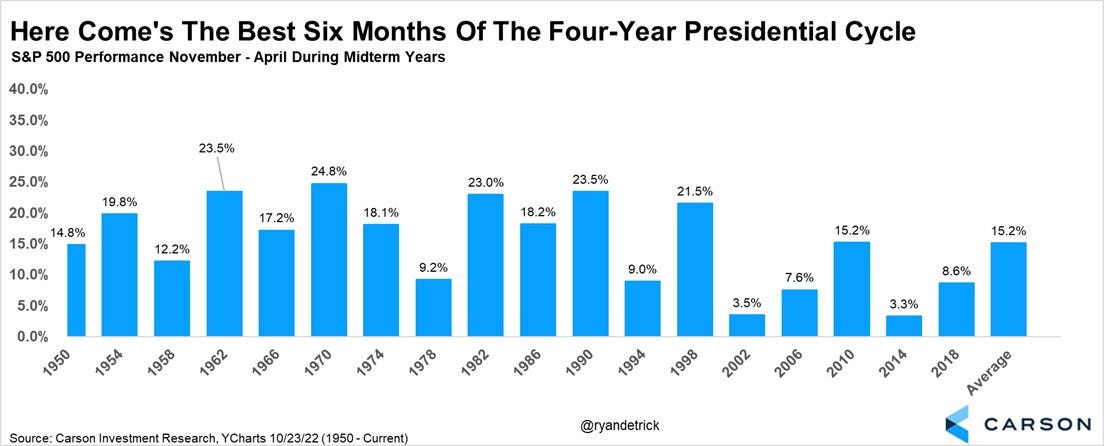
Need even more pep in your step? The best 6 months of a 4-year presidential election cycle are coming right up. We are just around the corner from the November-April period which have been higher 18 of the past 18 times during a mid-term year.
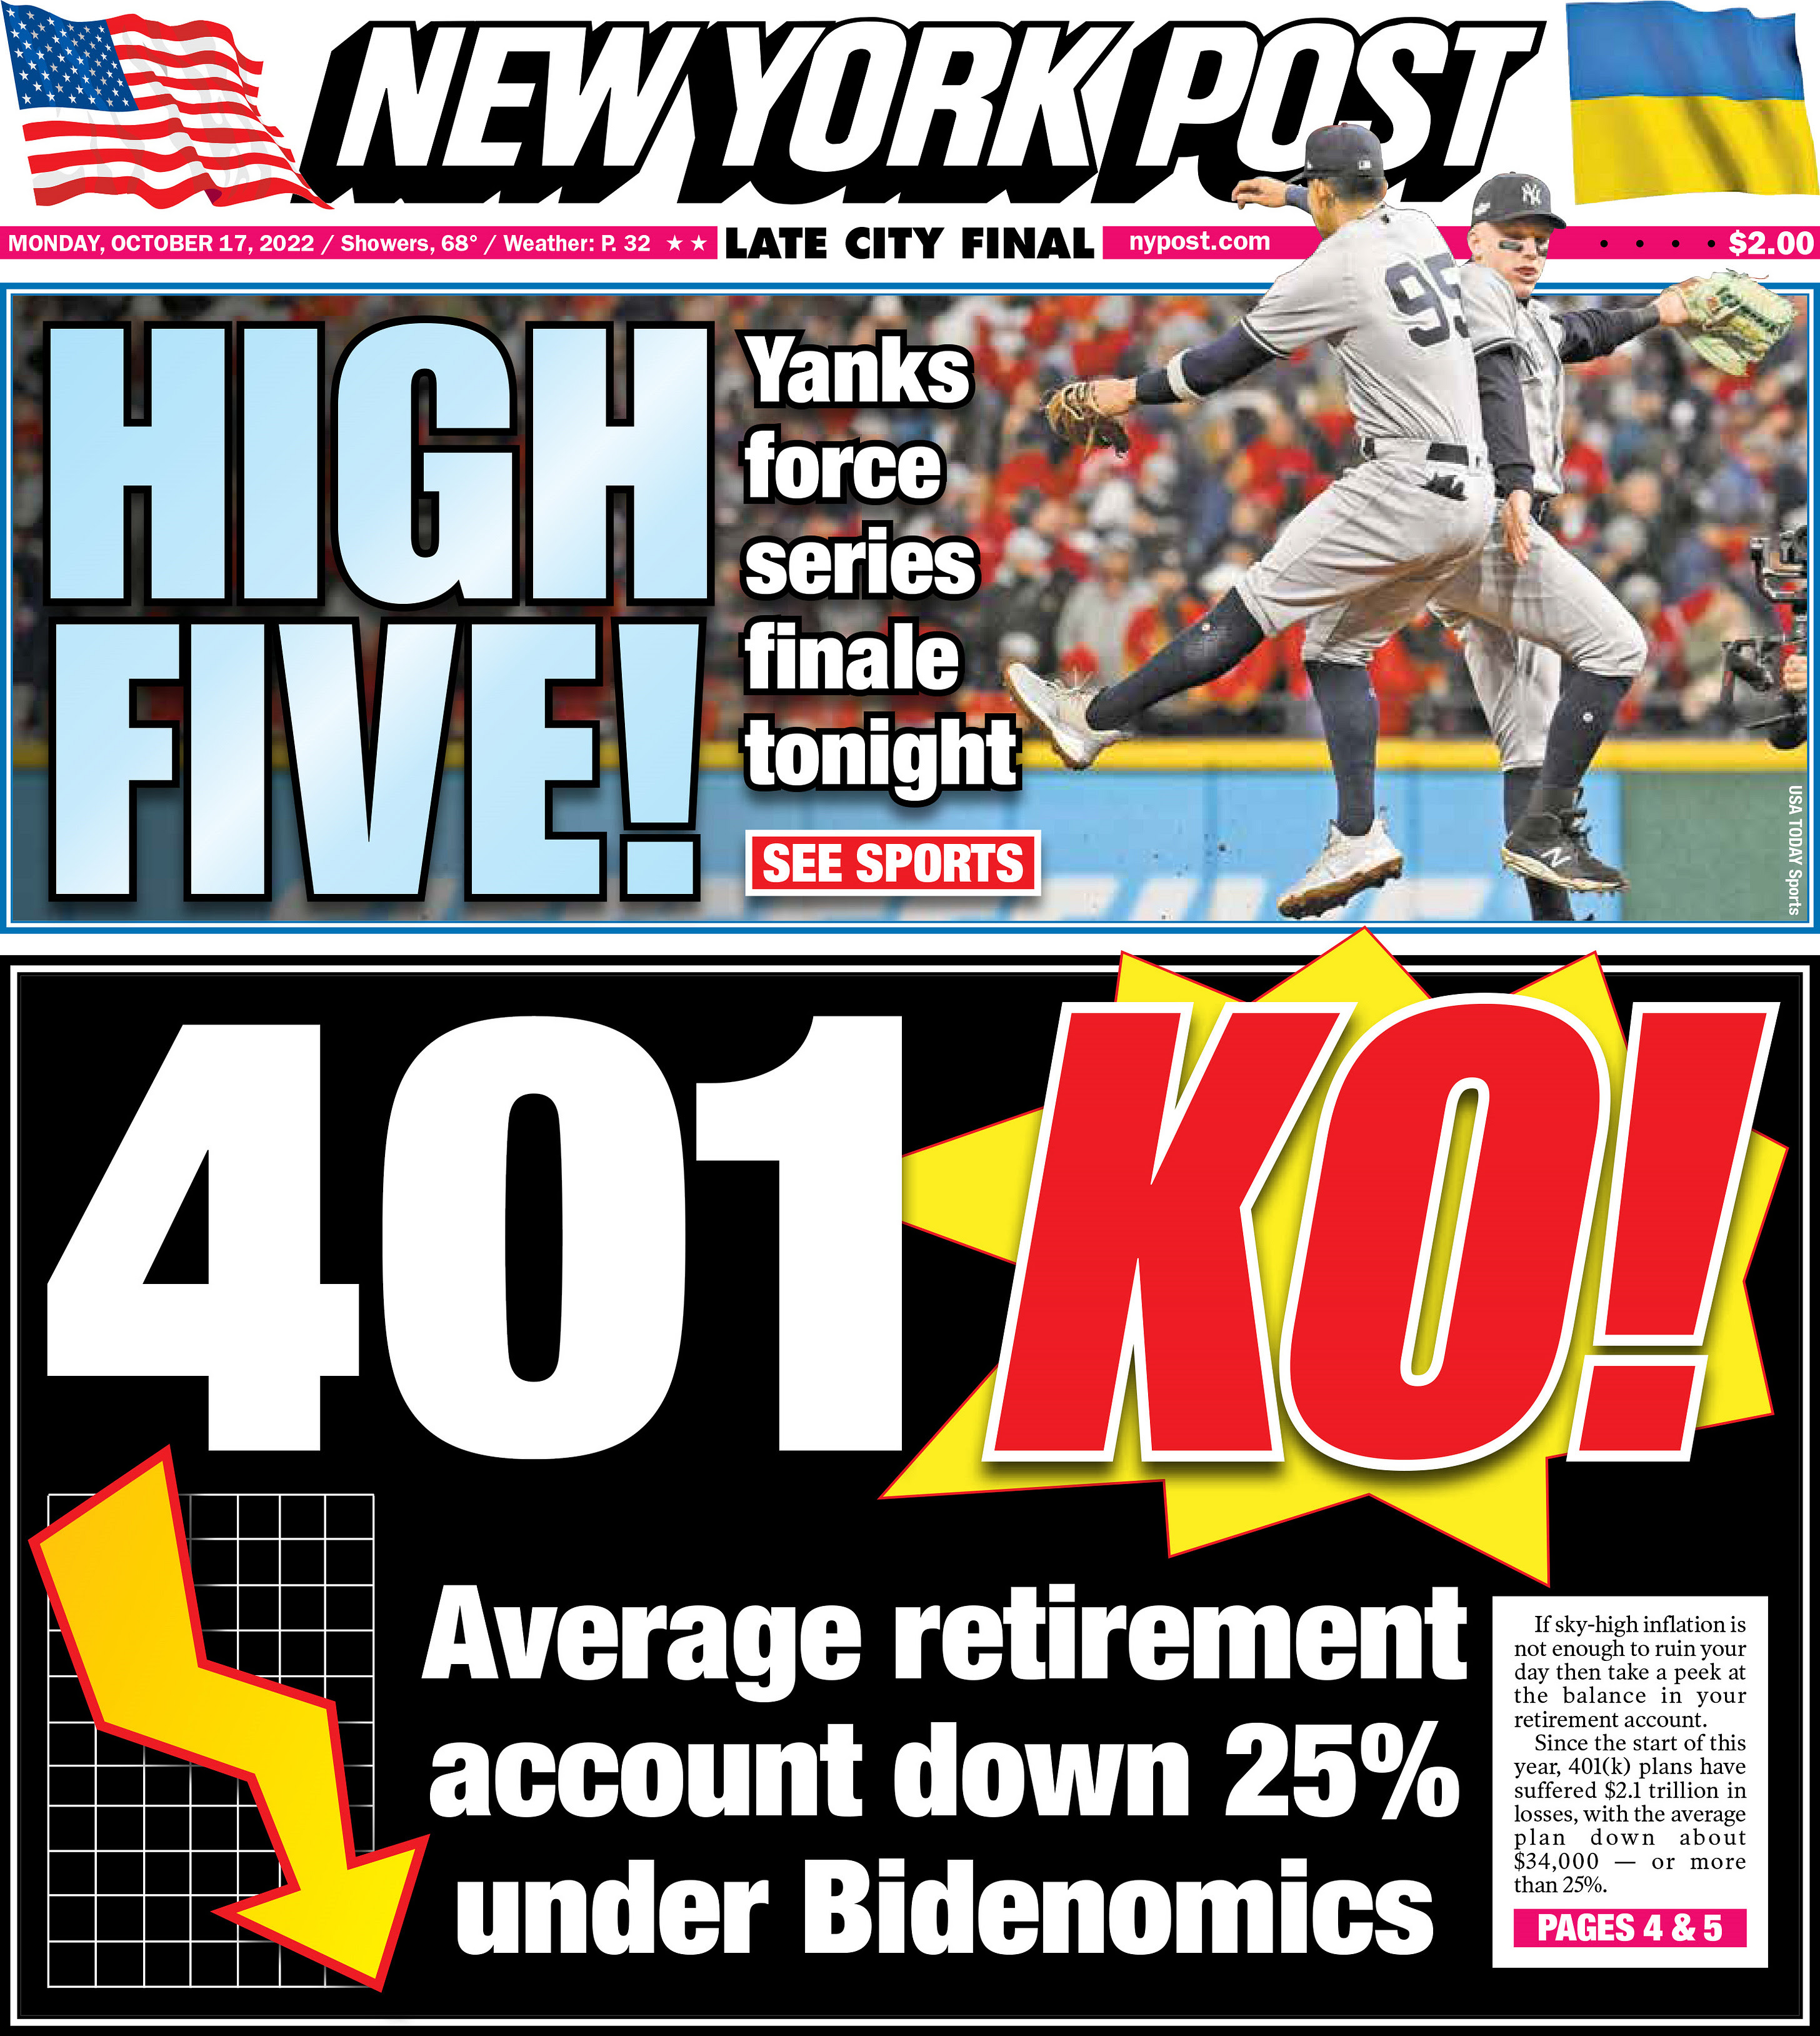
The "Magazine Cover Indicator"
Of course there is no single, infallible market signal, but when non-finance magazines feature headlines about how bad markets have become, it is also a bullish sign that too many pessimists are on the wrong side of the ship..
Do you recall this TIME cover 7 months after the market bottomed during the Global Financial Crisis? The Dow Jones Industrial Average is up ~25,000 points since March 2009 lows.

And then this one from The New Yorker? The Nasdaq bottomed two days after publication and began one of its most historic runs of all time.

Well, here's the sort of magazine cover we're seeing right now. History doesn't always repeat, but it more often than not rhymes!
Finally, bonds have deeply disappointed investors this market cycle and have utterly failed to provide the sort of safe harbor traditionally expected due to record inflation and record FED "tightening" or rapid raising of interest rates in an attempt to combat inflation. In addition, investors are wary that the 40+ year bull market in bonds driven by a secular trend of ever-lower rates has come to an end.
For example, the iShares 20+ Year Treasury Bond ETF (TLT) closed at new lows this week and is now down an unbelieveable -43.67% from its most recent high in August 2020 – a much deeper drawdown than any other in its history. In our opinion, this makes investors far less reticent to re-enter stocks as the pain of loss has already been felt.

Today might seem dark but as students of market history we know the boom after this bust can be spectacular.
Right now, our job is to carefully and dilligently ferret out the very best opportunities this global fire sale has to offer– so that we can tale full advantage in order to continue building long term wealth and financial security for the families and clients entrusted to us!
Thank you for taking this exciting and rewarding voyage with us, and to our new clients,
WELCOME ON BOARD!
-------------------------------------------------------------
At Maendel Wealth we're passionate about helping clients make smart, well-informed decisions that make a meaningful and lasting impact in their lives and investments.
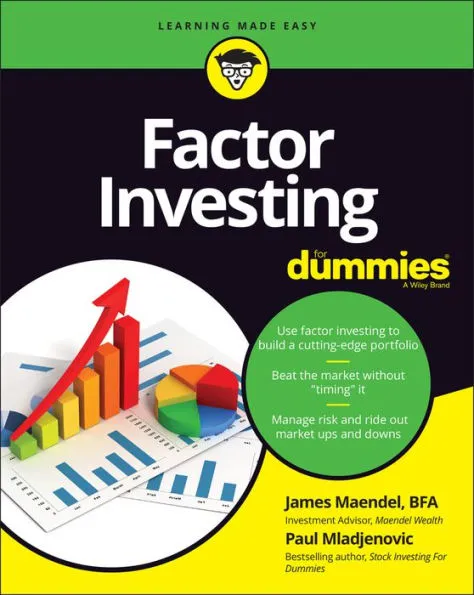
One of the key ways we do this is by working very hard to help you avoid the mistakes the majority of investors make near bear market bottoms (as Dalbar's annual research report repeatedly confirms). This "behavioral investing" approach is one of the many investment success "factors" highlighted in our new book "Factor Investing for Dummies" that will be on bookshelves December 1st, just in time for the Holidays.
Right now at Maendel Wealth we're optimizing, strategizing and consulting with our clients to fully embrace the recovery ahead.
If you'd like our team to provide a complimentary evaluation of your current porfolio, or discuss some of our top investment ideas, please reach out to us anytime, or just fill in the "Have A Question?" box which appears throughout the website. We'd love to have a chance to earn your business and to say "Welcome on Board!"
